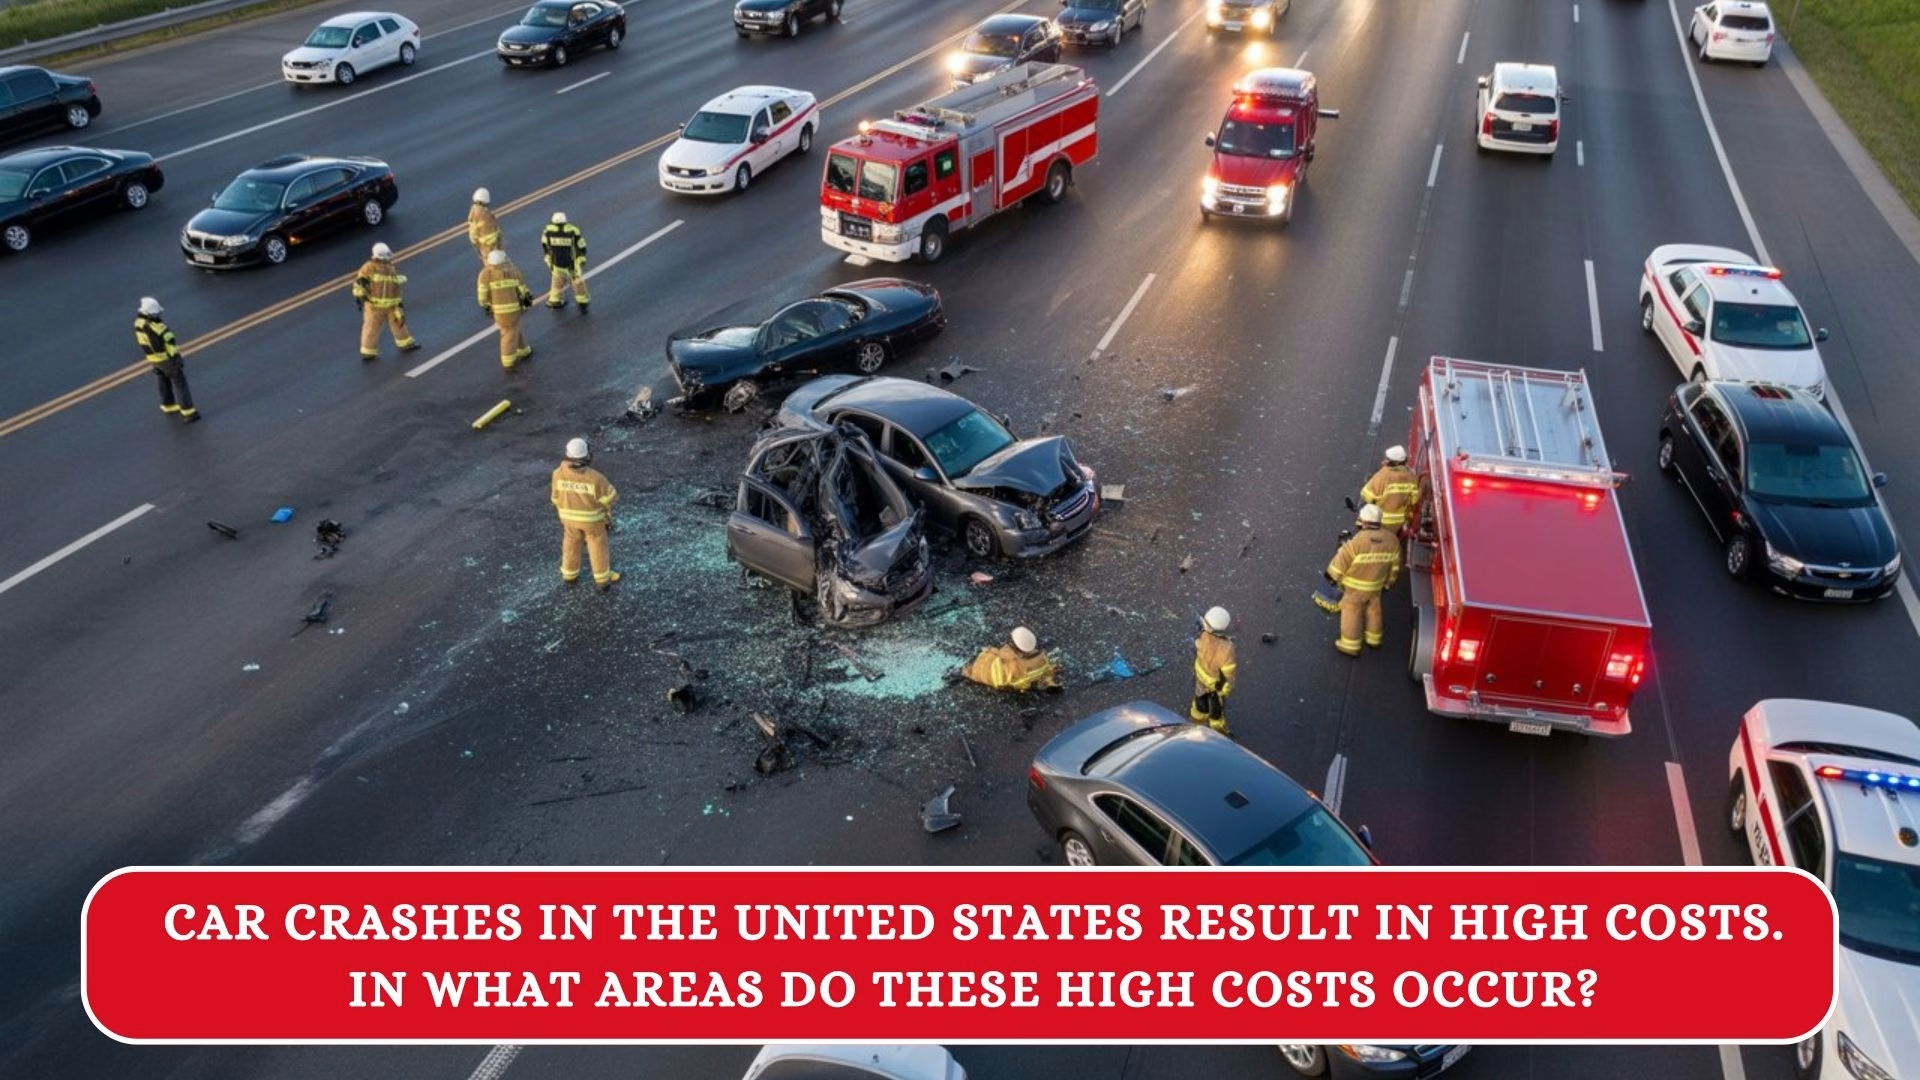
Car crashes create a massive financial burden across the United States, costing Americans $340 billion annually according to the National Highway Traffic Safety Administration (NHTSA). This translates to approximately $1,035 for every person in America—whether they were involved in an accident or not. What’s particularly striking is that roughly 75% of these costs are paid by people who weren’t even in the crashes, through increased insurance premiums, higher taxes, and other indirect expenses.
At Arnone’s Car Care, we understand that vehicle safety and proper maintenance play crucial roles in preventing these costly accidents. Understanding where these expenses occur helps drivers make informed decisions about vehicle care and road safety.
What Are the Major Areas Where Car Crash Costs Occur?
The financial impact of car crashes extends across seven primary areas, each contributing billions to the national burden. Here’s a breakdown of where these costs accumulate:
1. Medical and Healthcare Expenses
Medical costs represent the largest single expense category from car crashes. The 2019 data shows 4.5 million injuries nationwide, each requiring varying levels of medical intervention.

Healthcare costs include:
- Emergency room treatment and ambulance services
- Hospital stays and surgical procedures
- Physical therapy and rehabilitation services
- Prescription medications and medical equipment
- Mental health treatment for trauma and PTSD
- Funeral and burial expenses for fatal crashes
Modern trauma care is expensive, and even moderate injuries can generate tens of thousands of dollars in medical bills. Severe injuries often require months or years of ongoing treatment, creating long-term financial strain on families and the healthcare system.
2. Lost Productivity and Wages
When crash victims cannot work, the economic ripple effects impact individuals, employers, and the broader economy. Lost productivity represents one of the largest hidden costs of traffic accidents.
| Impact Category | Economic Effect |
| Individual Workers | Lost wages during recovery, reduced earning capacity, missed career opportunities |
| Businesses | Decreased productivity, costs of hiring temporary replacements, project delays |
| Fatal Crashes | Lifetime economic loss of approximately $1.6 million per fatality |
| Young Victims | Higher lifetime work loss costs due to more productive years ahead |
Traffic accidents are the leading cause of death for Americans aged 1 to 35, making lost productivity costs particularly devastating for younger demographics.
3. Property Damage and Vehicle Repair Costs
Modern vehicle complexity has dramatically increased repair expenses. In 2019, 23 million vehicles were damaged in crashes, with 84% involving property damage only.
Property Damage Costs: $76 Billion Breakdown
2019 VEHICLE AND INFRASTRUCTURE DAMAGE ANALYSIS
Why Repair Costs Keep Rising
Today’s vehicles contain advanced technology including multiple sensors, computer modules, and integrated safety systems. A minor collision now requires replacing parking sensors, cameras, lane assist systems, and other electronics—not just traditional bodywork. Even property-damage-only crashes cost significantly more than a decade ago.
Public Infrastructure Damage
Crashes also damage roads, guardrails, traffic signals, and street signs. These repairs are funded through taxpayer dollars, adding billions more to the collective burden.
4. Legal and Administrative Expenses
Insurance claims, legal proceedings, and administrative processes add billions in costs. Every crash triggers a complex chain of documentation, investigation, and potential litigation.
Legal and administrative costs include:
- Insurance claim processing and investigation
- Attorney fees and court costs for disputed cases
- Expert witness expenses in litigation
- Law enforcement response and investigation
- Accident report documentation and filing
- Multi-year legal battles for serious injury cases
Even straightforward insurance claims require coordination between adjusters, repair shops, and medical providers—all adding to administrative expenses.
5. Traffic Congestion and Environmental Impact
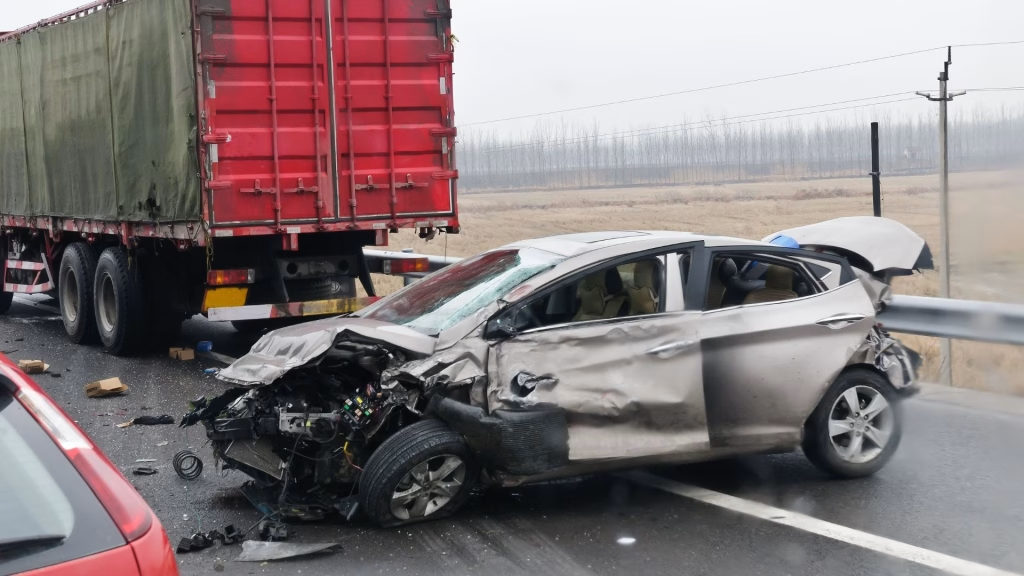
Crashes create ripple effects that cost society $36 billion annually through congestion alone. When accidents block traffic, the impact extends far beyond those directly involved.
| Congestion Cost Factor | Annual Impact |
| Excess Fuel Consumption | Billions in wasted gasoline from idling vehicles |
| Travel Delays | Hours of lost productivity across entire populations |
| Greenhouse Gas Emissions | Increased pollution from vehicles stuck in traffic |
| Air Quality Degradation | Environmental and health impacts from emissions |
A single rush-hour accident can create traffic jams lasting hours, affecting thousands of commuters and representing a hidden tax paid through wasted time and fuel.
6. Insurance Premiums and Taxpayer Burden
Americans who never experience accidents still pay substantial costs through higher insurance rates and taxes. This shared burden affects every household in the nation.
How Costs Are Distributed
Insurance companies spread crash expenses across their entire customer base. When claims increase, premiums rise for everyone—meaning safe drivers subsidize accidents they didn’t cause. Safe drivers effectively pay for the mistakes of others through this system.
Taxpayer Contributions
Taxpayers contribute approximately $30 billion annually (9% of total crash costs), averaging $230 per household. These public funds cover:
- Emergency services (fire, police, paramedics)
- Roadway repairs and infrastructure replacement
- Public hospital costs for uninsured crash victims
- Traffic management and accident investigation
7. Quality of Life and Psychological Costs
Beyond measurable expenses, crashes create immeasurable human suffering. When considering quality-of-life valuations alongside economic costs, total societal harm reaches $1.4 trillion—more than four times the purely economic calculation.
Non-economic impacts include:
- Chronic pain lasting years or permanently
- Post-traumatic stress disorder (PTSD) affecting daily life
- Lost companionship and emotional support for families
- Permanent lifestyle limitations and adjustments
- Psychological trauma requiring ongoing treatment
- Community loss of valuable members
These costs don’t appear on any bill but represent the true devastation crashes inflict on individuals, families, and communities.
Specific Risk Factors Driving Higher Costs
Certain behaviors contribute disproportionately to crash expenses, creating opportunities for prevention:
| Risk Factor | Annual Cost | Crashes/Injuries/Fatalities |
| Distracted Driving | $98.2 billion (29% of total) | 1.3 million injuries, 10,546 deaths |
| Alcohol-Involved Crashes | $68.9 billion (20% of total) | 497,000 injuries, 14,219 deaths |
| Speeding | $141 per U.S. person | Major contributor to crash severity |
| Not Wearing Seat Belts | $11 billion (3% of total) | Entirely preventable expenses |
Key insight: Increased seat belt use between 1975 and 2019 saved an estimated $17.8 trillion in societal harm, demonstrating how simple safety measures create massive economic benefits.
Who Pays These Costs?
The financial burden of car crashes doesn’t fall equally on everyone involved. As mentioned earlier, about three-quarters of all crash costs are paid by people not directly involved in the accidents. This occurs through:
- Insurance premiums: All policyholders in a region see rate increases when crash rates rise
- Taxes: Federal, state, and local governments use tax revenue to fund emergency services, road repairs, and public healthcare programs that treat accident victims
- Medical costs: Uninsured and underinsured crash victims often cannot pay their medical bills, causing hospitals to increase prices for everyone
- Productivity losses: When businesses lose trained employees or face shipping delays, they pass costs along to consumers through higher prices
American taxpayers contribute approximately $30 billion annually toward crash-related expenses, equivalent to about $230 per household.
The Broader Economic Impact
Looking beyond the $340 billion in direct economic costs, the National Highway Traffic Safety Administration estimates that when you include quality-of-life losses, the comprehensive cost of motor vehicle crashes reaches approximately $1.4 trillion annually.
Motor vehicle crashes represented 1.6% of the United States’ $21.4 trillion gross domestic product in 2019. This massive economic drain affects:
- National economic growth and productivity
- Healthcare system resources and capacity
- Infrastructure maintenance budgets
- Business competitiveness and efficiency
- Family financial security and quality of life
Crashes disproportionately impact younger Americans, with motor vehicle accidents being the leading cause of death for people aged 1 to 35. Because younger victims lose more potential lifetime earnings, their crashes generate higher long-term economic costs.
How These Costs Can Be Reduced?
While the financial burden of crashes seems overwhelming, many of these costs are entirely preventable. Effective strategies for reducing crash-related expenses include:
- Preventive Vehicle Maintenance: Regular vehicle service catches potential problems before they cause accidents.
- Driver Education and Awareness: Understanding the risks of speeding, distracted driving, and impaired driving helps motorists make safer choices.
- Technology Adoption: Modern safety features like automatic emergency braking, lane departure warnings, and blind spot monitoring can prevent many common crash types.
- Infrastructure Improvements: Better road design, clearer signage, and improved lighting reduce accident risks.
- Strict Enforcement: Sobriety checkpoints, speed enforcement, and distracted driving laws deter dangerous behaviors.
- Adequate Insurance Coverage: Carrying sufficient insurance protection helps manage financial risks when accidents do occur. This includes liability coverage, collision coverage, and uninsured motorist protection.
Prevention: The Most Cost-Effective Solution
Every prevented crash saves lives and reduces the collective financial burden on American society. Effective prevention strategies deliver substantial returns:
Proven prevention methods include:
- Graduated driver licensing for new drivers
- Sobriety checkpoints and ignition interlocks
- Primary seat belt laws and enforcement
- Advanced vehicle safety features (automatic emergency braking, stability control)
- Regular vehicle maintenance and safety inspections
- Avoiding distracted driving and speeding
- Never driving under the influence
Individual drivers make a difference through responsible behavior and vehicle maintenance. The $340 billion annual cost of crashes represents money that could be directed toward productive uses in our economy—making prevention both a humanitarian and economic imperative.
FAQs
Q. How much do car crashes cost the U.S. annually?
Car crashes cost the U.S. around $340 billion annually in direct economic losses, based on 2019 data from NHTSA. When accounting for the impact on quality of life, the total cost rises to about $1.4 trillion each year.
Q. How big is the property damage and vehicle repair cost component?
Property damage and vehicle repairs make up $76 billion of the annual crash costs, with $52 billion spent on vehicle repairs, $18 billion on replacements, and $6 billion on infrastructure damage like road repairs and guardrails.
Q. Who pays for the costs of car crashes in America?
Around 75% of the costs are borne by people not directly involved in the crashes, through higher insurance premiums, increased taxes for emergency services, and rising healthcare costs.
Q. Why do crash costs persist and continue rising each year?
Crash costs rise due to more advanced vehicle technology, increasing healthcare costs, rising labor costs for repairs, and more expensive legal and administrative processes. Modern vehicles are more expensive to repair due to sophisticated systems and sensors.
Q. What areas account for the highest costs in car crashes?
The highest costs stem from lost workplace productivity ($65 billion), property damage ($76 billion), medical and emergency care ($61 billion), traffic congestion ($36 billion), and legal expenses ($18 billion), all of which make up most of the $340 billion total.
